It started as a typical Monday afternoon, but it quickly turned into a live-action case study in sales experimentation. My husband and I realized our neighborhood was being “pitched” by the same lawn care company, but the math wasn’t adding up. We were looking at Version A: 8 treatments a year, the first one free, and the rest at a flat $75. Meanwhile, a quick chat with the neighbors revealed they were being offered Version B: a 15% discount across the board ($64 per treatment) plus a 50% “welcome” discount on that first visit, bringing it down to just $32.
As a tech person, I couldn’t help but look past the grass seed and see the data strategy at play. This wasn’t just a sales rep being generous; it was a textbook A/B test designed to measure customer psychology and conversion triggers. Is the “Free” hook of Version A more powerful than the long-term, compounded savings of Version B? By deploying different variables to different houses, the company was essentially running a real-world query to see which “algorithm” would win the neighborhood. Consider this my front-row seat to how modern sales teams use data to pivot their strategy—proving that whether you’re building a data pipeline or a beautiful lawn, everything is an experiment waiting to be analyzed.
At its core, A/B testing is a randomized experiment – you compare two versions of a single variable to see which performs better against a specific goal. Begin with a version A marketing asset (email, flyer, web, ad) and a version B to isolate what actually drives the result. “Randomization” is mandatory for success; You must assign your versions to similar groups without bias to ensure your data is not skewed. You then track a clear metric until reaching statistical significance, proving the outcome wasn’t just a lucky fluke. This process strips away the guesswork, by the time the experiment ends, with the data facts and analytic results —you’re scaling a proven winner.
Without further ado, let me step into an analyst role in the process and explain how I would conduct an A/B testing data analysis in this case. First, I will create a dataset that collects all users who were exposed to version A and version B. They should be the same size. Here are the sample dummy data that were created. I have 20 users pitched by each version.
In case you are not interested in opening the sheet, here is a sample view of the data structure [total_sample]. This dataset captures the total surveyed users, if they sign up, and which version they were provided.
| user_id | sign_up | sign_date | group_version |
| 1 | Y | 2/11/26 | A |
| 2 | N | A |
Another dataset total_sales, collects all the services each customer purchased. Over time, customers in both version groups may churn. from [session] data point can identify the user/customers’ last service session with the company. user_id is a unique customer identifier.
| user_id | session | sale_price | version_group | treatment_cost | treatment_date | net_revenue |
| 1 | 1 | 0 | A | 10 | 4/1/26 | -10 |
With this data, we can now identify several metrics, CR (conversion rate) – this is the customer sign-up rate, total net revenue, retention, and ARPU.
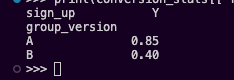
CR – very simple, only need to have each group sign up total count/ total users. This metric measures the efficiency of the top-of-funnel marketing.
SQL:
SELECT group_version, COUNT(*) AS total_exposed, SUM(CASE WHEN sign_up = 'Y' THEN 1 ELSE 0 END) AS conversions, ROUND(AVG(CASE WHEN sign_up = 'Y' THEN 1.0 ELSE 0.0 END), 4) AS conversion_rateFROM total_sampleGROUP BY group_version;
Python:
import pandas as pdtotal_sample = pd.read_excel('lawncare_A_B_Testing.xlsx')print(total_sample.head())conversion_stats = total_sample.groupby('group_version')['sign_up'].value_counts(normalize=True).unstack()conversion_stats['conversion_rate'] = conversion_stats['Y']print(conversion_stats[['Y']])
Result:
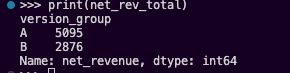
Total Net Revenue (LTV to Date) – This measures the actual “cash in hand” after accounting for the $10 per-session cost.
SQL:
SELECT version_group, SUM(sale_price - treatment_cost) AS total_net_revenueFROM total_salesGROUP BY version_group;
Python:
total_sales = pd.read_excel('lawncare_A_B_Testing.xlsx',sheet_name='total_sales') # Assuming the sales data is in a separate sheettotal_sales['net_revenue'] = total_sales['sale_price'] - total_sales['treatment_cost']net_rev_total = total_sales.groupby('version_group')['net_revenue'].sum()print(net_rev_total)
Result:
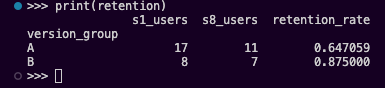
Final Retention – we define retention here as the percentage of users who reached the final session (Session 8) out of those who attended the first session.
SQL:
WITH session_counts AS ( SELECT version_group, COUNT(DISTINCT CASE WHEN session = 1 THEN user_id END) AS start_users, COUNT(DISTINCT CASE WHEN session = 8 THEN user_id END) AS end_users FROM total_sales GROUP BY version_group)SELECT version_group, CAST(end_users AS FLOAT) / start_users AS retention_rateFROM session_counts;
Python:
retention = total_sales.groupby('version_group').agg( s1_users=('user_id', lambda x: x[total_sales['session'] == 1].nunique()), s8_users=('user_id', lambda x: x[total_sales['session'] == 8].nunique()))retention['retention_rate'] = retention['s8_users'] / retention['s1_users']print(retention)
Result:
| Metric | Version A (Free Trial) | Version B (Discounted) | Comparison |
| Initial Sign-ups | 17 | 8 | A is +112% better |
| Total Net Revenue | $5,355 | $2,876 | A is +86% higher |
| Final Retention (S1 → S8) | 64.70% | 87.50% | B is +22.8% stickier |
ARPU – Average revenue per user, it shows which model is more efficient per customer. This would be a tough one, over time, customer churns. Choose a Cumulative Cohort ARPU or Period over Period ARPU, which can impact the Break-Even analysis. I feel period over period is a better fit because over time, the customer count tends to be stable, and the longer it stays with the company, the less chance they will churn with the current offer. here i user session as a period factor.
SQL:
SELECT version_group, session, COUNT(DISTINCT user_id) AS active_users, SUM(sale_price - treatment_cost) AS session_net_revenue, -- This shows the 'purity' of the revenue per active user SUM(sale_price - treatment_cost) / COUNT(DISTINCT user_id) AS active_arpuFROM total_salesGROUP BY version_group, sessionORDER BY session, version_group;
Python:
# 1. Calculate Per-Session Metricssession_stats = total_sales.groupby(['version_group', 'session']).agg( active_users=('user_id', 'nunique'), session_net_rev=('net_revenue', 'sum')).reset_index()# 2. Calculate Active ARPUsession_stats['active_arpu'] = session_stats['session_net_rev'] / session_stats['active_users']# Pivot for side-by-side comparisoncomparison = session_stats.pivot(index='session', columns='version_group', values='active_arpu')print(comparison)
Result:
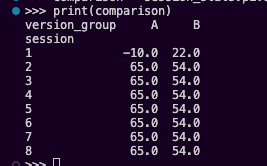
If you look only at Session 8, the “Period ARPU” results are:
- Version A: $65 per active user ($780 revenue / 12 users).
- Version B: $54 per active user ($378 revenue / 7 users).
Even in the “smaller window” of the most recent session, Version A is still more efficient. It has higher “purity” because it charges $75 vs. $64. However, if churn is the key to Version B’s potential, Version A’s active count dropped to 5 users and Version B stayed at 7 users, Version B would finally overtake A in total session revenue ($378 vs. $325).
So what’s next? Should businesses make a decision now? I wouldn’t – I actually want to make a long-tail projection, we have seen the churn rate in real data for each version group, so why not model what will happen based on the decay rates that have been observed?
I assume a churn rate for future sessions based on previous historical data:
- Version A showed “Early-Stage Churn” (losing ~30% in the first 3 sessions). We will project a conservative 5% linear churn per session thereafter.
- Version B showed “High-Intent Stability” (losing only ~12% by Session 8). We will project a 1% linear churn per session.
Before projecting, we need a clean “State of the Union” at Session 8. We will use a loop to simulate the next 16 sessions.
Python:
# Current state at end of Session 8data = { 'A': {'users': 12, 'margin': 65, 'total_profit': 5355, 'churn': 0.05}, 'B': {'users': 7, 'margin': 54, 'total_profit': 3146, 'churn': 0.01}}projection = []for s in range(9, 25): for group in ['A', 'B']: # Apply churn to the user count data[group]['users'] *= (1 - data[group]['churn']) # Calculate session profit session_profit = data[group]['users'] * data[group]['margin'] # Update cumulative total data[group]['total_profit'] += session_profit projection.append({ 'Session': s, 'Group': group, 'Active_Users': round(data[group]['users'], 2), 'Cumulative_Profit': round(data[group]['total_profit'], 2) })df_projection = pd.DataFrame(projection)projection_end = df_projection[df_projection['Session'] == 24]
Results:
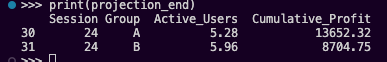
| Metric | Version A | Version B | The Winner |
| Active Users (S24) | 5.3 | 5.9 | Version B |
| Session Profit (S24) | $344.50 | $318.60 | Version A |
| Total Cumulative Profit | $13,652 | $8,705 | Version A |
Even though Version B eventually ends up with more active users due to its superior retention, it cannot overcome two massive hurdles:
- The Margin Gap: Version A earns $11 more profit per user per session ($65 vs $54).
- The Head Start: Version A began with 17 users while Version B only had 8. By Session 8, Version A already had a big profit lead.
To reach a “Break-Even” where Version B’s total profit equals Version A’s, Version A’s churn would have to accelerate to over 15% per session, or the test would have to run for roughly 150 sessions (nearly 3 years of weekly treatments).
Strategy proposal:
From the data view to provide a strategy standpoint, here is the takeaway: Don’t chase the retention of B, fix the margin and acquisition of A.
Version A’s “Free Session” is a powerhouse for acquisition. The 30% early churn is a “feature,” not a bug—it’s the cost of filtering out low-value users. Once those users are gone, the remaining “Core” in Group A is actually more profitablethan the high-intent users in Group B because they are paying a higher price point.
The Hybrid Action Plan:
- Keep the Version A acquisition model (Free Session 1).
- Implement the Version B retention “Lock-in”: Perhaps offer a discount if users pre-pay for 8 sessions after their free trial, which might give you A’s volume with B’s stickiness.
I hope my Lawn care story inspires you. Keep observing and enjoy exploring the data in your daily life!

Leave a comment